In practice, any developer or system administrator encounters a terrible problem - the database slows down. The server is running slowly, something strange is happening, users are complaining, the client is angry. It was not for nothing that I wrote that the problem is terrible, first of all because the solution here will not be obvious and it does not lie on the surface. Many parameters can affect database performance.
In this article, I tried to cover most of them, and also list those commands that help me understand the reasons for the slow operation of the server or database.
Below are the steps you should go through to understand the cause of the problem.
1. Let's see what has been done before.
To do this, your application must have Git. We go into it and see what was done earlier. What migrations did you do, what settings did you change.
And it is desirable that the main database configuration file postgresql.conf is also in the git. Then you can, among other things, control and change the base settings.
Of course, you should make it a rule not to change anything in the database directly, but to carry out everything through git and migrations.
Especially when it comes to changing the structure of the database, adding handlers, user-defined functions, procedures. This job should be done by scripts, which, in turn, should be versioned.
2. Look at what is happening in the operating system.
If there were no changes in the git, and the problem appeared unexpectedly, then the next thing to pay attention to is what was happening in the operating system.
Hopefully you have the database installed on your Linux machine. If not, I advise you to consider moving to Linux.
Remember what antivirus or firewalls you installed. See what applications or services are lifted on the server besides the database. The best approach is to keep only the database on the server and nothing more. Fortunately, current virtualization technologies make it very quick and easy to do.
3. Check the equipment.
Again, if you have not changed anything in the operating system, you already have Linux, you should pay attention to the hardware. Today, some hardware manufacturers are guilty of quality and one cannot hope that memory or hard disk will not fail at the most inopportune moment. Therefore, the first thing I advise you to pay attention to:
htop
If you see that the processor is 70% or more loaded and all cores are loaded, then consider increasing the power. Processors are cheap now, and if you are using virtualization then add more cores to your database. Most likely, your database has no longer enough capacity due to the increased load and you should think about upgrading the server.
iostat –dx
Pay attention to the last column. It will give you an idea of how the disk subsystem is loaded. If the indicator approaches 100%, then you need to think about increasing memory. Most likely, you have a very large database size, and there is not enough RAM on the server to process the data.
Remember, the expense of optimizing queries or application code will not pay off if you have hardware issues.
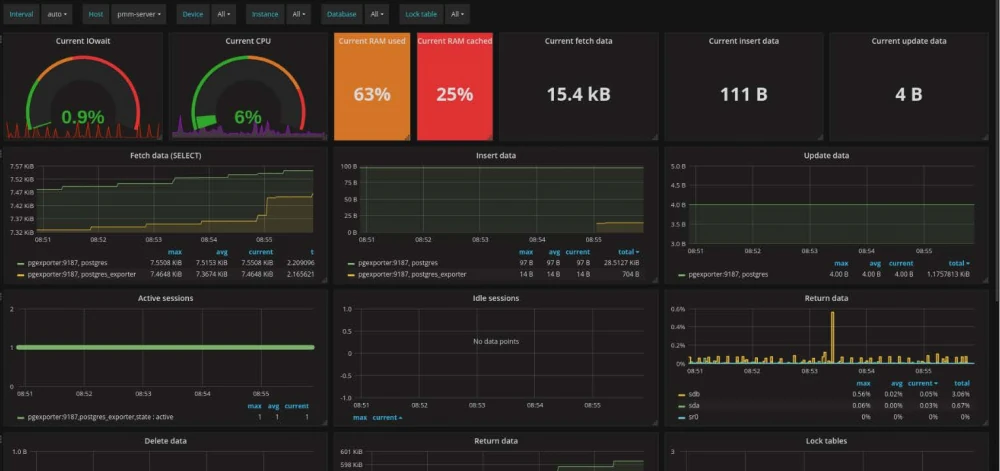
4. Install a monitoring system.
Try installing the Percona monitoring system https://www.percona.com/software/database-tools/percona-monitoring-and-management. Its interface is shown in the picture above. It is free and will allow you to quickly assess the dynamics of the server load and show all the main indicators of the server operation.
5. Analyze the file storage.
Run the command:
iostat –x
Take a look at the columns from the _await postfix. They tell you about f/s latency. If the indicator is more than 50 ms without load, then it is worth considering. If more than 100 - then it is worth taking urgent measures.
The reason for the high numbers may be incorrect configuration of the hypervisor or the operation of the base through the NAS. This latter design approach should be avoided.
6. Analyzing pg_stat_activity.
So, we checked the servers, equipment, and found nothing unusual. Let's go directly to tuning of database.
The first thing that comes to mind is the pg_stat_activity view.
First, check the track_activity_query_size parameter in the database settings, by default it is set to 1024. Increase it at least 2-3 times, in most cases it is not enough.
Now we are looking for what activity we have in the database. Maybe everything is much simpler and someone has launched a complex query and you should stop this script. We look at active requests lasting more than 5 seconds:
SELECT now () - query_start as "runtime", usename, datname, wait_event, state, query FROM pg_stat_activity WHERE now () - query_start> '5 seconds' :: interval and state = 'active' ORDER BY runtime DESC;
Queries with the "idle" status can also cause suspicion. And even worse with the "idle in transaction" state.
Such requests can be stopped with the following commands:
SELECT pg_cancel_backend (procpid);
SELECT pg_terminate_backend (procpid);
The first will stop active requests, the second with the idle type.
Now worth a look if you have any pending transactions. We execute the request:
SELECT pid, xact_start, now () - xact_start AS duration FROM pg_stat_activity WHERE state LIKE '% transaction%' ORDER BY 3 DESC;
Remember, transactions must be done instantly. From response check duration. If the transaction hangs for several minutes, and even more so for hours, then the application behaved incorrectly, leaving the transaction incomplete. And this affects replication, VACUUM, WAL.
7. Analyzing pg_stat_statements.
If earlier we checked active requests, now is the time to analyze what happened before. The pg_stat_statements view will help us with this. But usually it is disabled by default, we need to enable it. To do this, insert the following line in the database config:
shared_preload_libraries = 'pg_stat_statements'
Then, in the current session with the database, run the command:
create extension pg_stat_statements;
If you plan to deal with the performance of the base, then you need it. You cannot do many things without it. Of course, it will take up a little disk space, but compared to the advantages, this will not be scary.
With it, you can get statistics on already executed requests.
For example, we can get requests with the maximum CPU load with the following command:
SELECT substring (query, 1, 50) AS short_query, round (total_time :: numeric, 2) AS
total_time, calls, rows, round (total_time :: numeric / calls, 2) AS avg_time, round ((100 *
total_time / sum (total_time :: numeric) OVER ()) :: numeric, 2) AS percentage_cpu FROM
pg_stat_statements ORDER BY total_time DESC LIMIT 20;
And the longest requests are like this:
SELECT substring (query, 1, 100) AS short_query, round (total_time :: numeric, 2) AS
total_time, calls, rows, round (total_time :: numeric / calls, 2) AS avg_time, round ((100 *
total_time / sum (total_time :: numeric) OVER ()) :: numeric, 2) AS percentage_cpu FROM
pg_stat_statements ORDER BY avg_time DESC LIMIT 20;
This way we can understand which queries are heavily affecting the load on our database and optimize them if necessary.
8. Working with the pg_stat_user_tables view
The pg_stat_user_tables table is a key competitive advantage over other databases. Using it, we, for example, get information about sequential reading from disk:
SELECT schemaname, relname, seq_scan, seq_tup_read, seq_tup_read / seq_scan AS avg, idx_scan
FROM pg_stat_user_tables
WHERE seq_scan> 0
ORDER BY seq_tup_read DESC
LIMIT 25;
At the top of the tables, there will be exactly the same operations that read data from disk. If the table has more than 2000 records, then such operations should be performed by index, and not from disk. Those. you will receive first of all those queries that you need to optimize.
You should also look at the caching of these tables by the pg_statio_user_tables view.
The heap_blks ... and idx_blks ... columns will help you with this.
9. Configuring memory for PostgreSQL.
Depending on the server settings, your settings will be approximately as follows:
effective_cache_size - 2/3 RAM
shared_buffers = RAM / 4
temp_buffers = 256MB
work_mem = RAM / 32
maintenance_work_mem = RAM / 16
But I recommend using special configurators:
http://pgconfigurator.cybertec.at/ is an advanced configurator from Cybertec.
https://pgtune.leopard.in.ua/ - online version of the classic pgtune configurator.
These tools will help you make the settings you want for you.
10. Configuring the disk subsystem.
If nothing else helped you, then as a last resort you can set the following settings:
fsync = off
full_page_writes = off
synchronous_commit = off
But in this case, you will lose in the reliability of data storage. But if your PostgreSQL is not the only system for data processing and the database is copied asynchronously to analytical systems, then you can live with such settings. As they reduce the load on the disk. I will explain a little about these parameters:
fsync - Log data is forcibly flushed to disk from the OS cache.
full_page_write - 4KB OS and 8KB Postgres.
synchronous_commit - The transaction is completed only when the data is actually flushed to disk.
checkpoint_completion_target - the closer to one, the less abrupt I/O jumps will be during checkpoint operations.
There is also effective_io_concurrency - by the number of disks and random_page_cost - the ratio of random reads to sequential reads.
They do not directly affect performance, but can significantly affect the operation of the optimizer.
11. Setting up the optimizer.
join_collapse_limit - how many permutations it makes sense to do to find the optimal query plan. An interesting parameter. The default is 10, it might make sense to increase it 10-20 times.
default_statistics_target The number of records to look for when collecting table statistics. The more, the harder it is to collect statistics. Statistics are needed, for example, to determine the "density" of data.
online_analyze - enables immediate statistics update
online_analyze.enable = on
online_analyze.table_type = "all"
geqo - enables genetic query optimization
enable_bitmapscan = on
enable_hashagg = on
enable_hashjoin = on
enable_indexscan = on
enable_indexonlyscan = on
enable_material = on
enable_mergejoin = on
enable_nestloop = on
enable_seqscan = on
enable_sort = on
enable_tidscan = on
12. Optimize queries.
So, you have found heavy queries, we explain or analyze them and the first thing you should pay attention to is the following phrases:
- Seq Scan - means that the query is made through a sequential search of table rows.
- Nested Loops - connection with nested loops.
For example, you might be alerted by the following response from the database:
Seq Scan ON test (cost = 0.00..40.00 ROWS = 20)
In the response, we also see how many rows will be processed, as well as the cost of the first line..all lines. It is considered quite original, it is worth looking here in a relative comparison.
Also, if Seq Scan on a table where rows are more than several thousand and at the same time there is a FILTER - in this case, you obviously need to look at the fields in FILTER and find a suitable index. If you haven't found it, then you have solved one of the problems.
I will not describe in detail the optimization of queries, this is a topic for a separate article.
The logic for reading the query plan is simple:
1) We look at the largest cost operator
2) Is it Seq Scan or nested loops?
3) Look at the next most expensive operator
Optimization most often ends with either adding an index, or simplifying the query (splitting into parts, using nested tables, etc.), or updating statistics, oddly enough.
To read plans, I recommend using the following service:
https://tatiyants.com/pev
What if the problem is reproduced in production?
In this case, you need to use the auto_explain parameter. It allows you to store the optimizer's response in one folder. Enabled by the following parameter:
session_preload_libraries = 'auto_explain'
auto_explain.log_min_duration = '3s'
auto_explain.log_analyze = true
Now we need to display the files in a beautiful form. PgBadger will help us with this. Generates beautiful html, but in the settings "you can drown".
https://github.com/darold/pgbadger
The simplest setting looks like this: pgbadger -j 4 -p '% t [% p]: [% l-1]' /var/log/postgresql/postgresql-9.6-main.log -o bad.html
On Prod, it is better not to enable auto_explain, or enable it as a last resort and for a short time. In cases where you do not have a drawdown on resources.
It is worth highlighting the most common errors:
- Database search using LIKE ‘% spoon%’. In this case, you need to think about moving your search to ElasticSearch. Or use FULL TEXT SEARCH.
- The caching system is not implemented. Then it's worth looking at this technology: https://github.com/ohmu/pgmemcache. After downloading and installing, do the following:
shared_preload_libraries = 'pgmemcache'
CREATE EXTENSION pgmemcache;
memcache_server_add ('hostname: port' :: TEXT)
Using:
memcache_add (key :: TEXT, value :: TEXT)
newval = memcache_decr (key :: TEXT)
memcache_delete (key :: TEXT)
If you need caching inside the DBMS or a temporary table in memory. But it is often convenient to use one ORM or the framework has limitations, or you just need to quickly replace the table with the inmemory KV storage.
- PostgreSQL is used as OLAP. The easiest option is to quickly move the data to the columnstore. https://github.com/citusdata/cstore_fdw
In this article, I have listed the main problems that developers face when working with databases. If you have an interesting case or experience, I will be glad if you send it to me by e-mail.